Data Collection
Biological Data Collection

Standard Operating Procedures
Below you will find standard operating procedures (SOP) for each of the data types (both in the field and out of the field) that our team is collecting. With this SOP you
will also find the following:
- An excel database for data entry that contains tables for each of the data types
we will be collecting/sharing. - An excel form with the two data sheets for use in the field.
When you first receive this information, we suggest reading through the SOP and having the database and data sheets open or available to ensure everything is clear and that we’ve provided enough information for you to collect data correctly and efficiently.
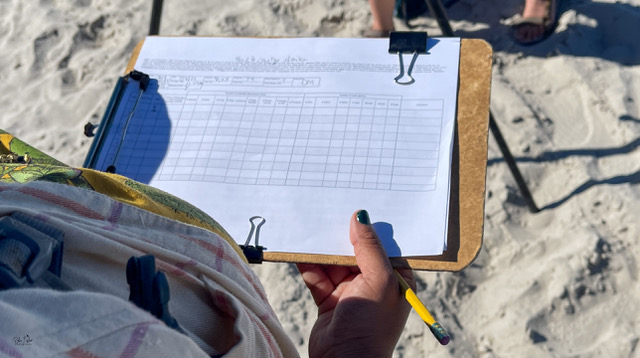
Atlantic Flyway Disturbance Data Sheets
Here you will find two separate data collection sheets for point counts and for behavioral samples. We developed the data sheets and standard operating procedures without knowing the specific sites that would be collecting data, but these methods are flexible. We recommend that you have at least two people in the field each time you are collecting data. This will optimize your ability to do point counts and especially behavioral samples, as you can have one person recording the data and the other conducting the point count and behavioral sample. If you are unable to go out with a partner, we recommend using a voice recorder or a voice recording smartphone app and transcribing the data onto a data sheet later.

Atlantic Flyway Disturbance Database
Enter your data from the data sheets into this Excel database. We suggest that you enter data into the database as often as possible. We recommend after each occasion in the field; however, that may not be possible and suggest that you attempt to enter data at least once/week. At the start of each season, you may want to enter data more frequently so you can troubleshoot any issues and make sure that data collection is going well.
Social Science Data Collection
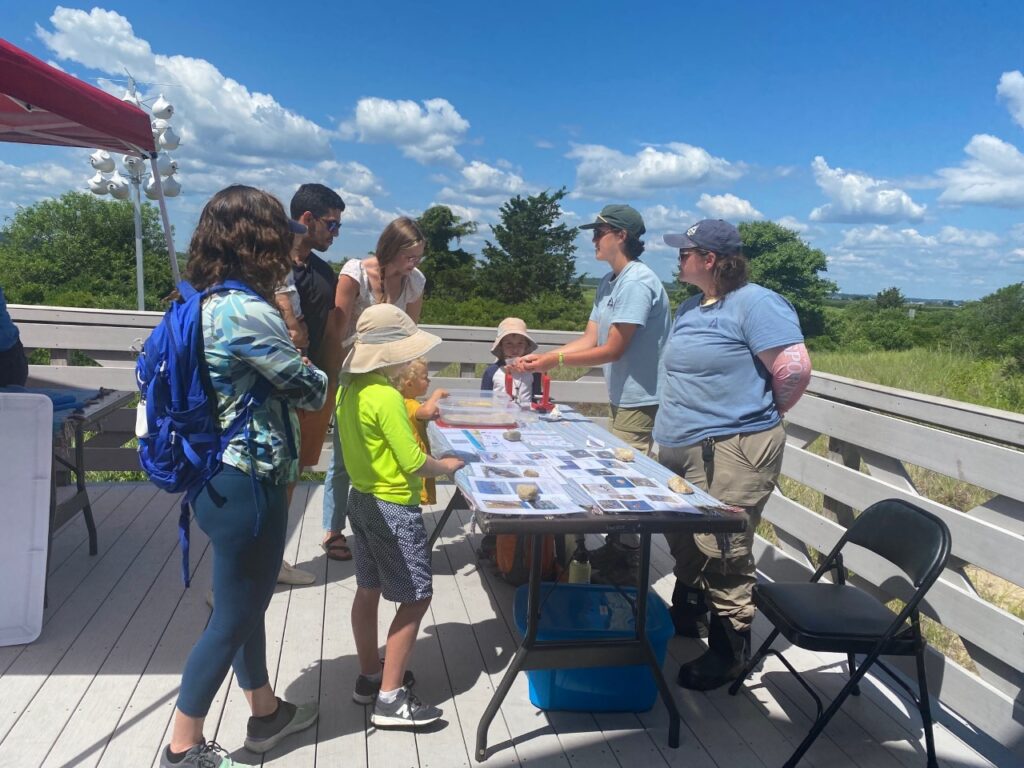
Outreach Evaluation Metrics Database
Use this database to record the number of people impacted by your campaign outreach and to quantify your behavior change strategies for easy reporting. Specific instructions for how to fill out each page can be found at the top of each excel sheet. Additional information on what to put in each cell can be found within comment boxes on column headers.

Outreach Evaluation Metrics Overview
A brief overview of how to use the Outreach Evaluation Metrics Database and suggested intervals for recording metrics.
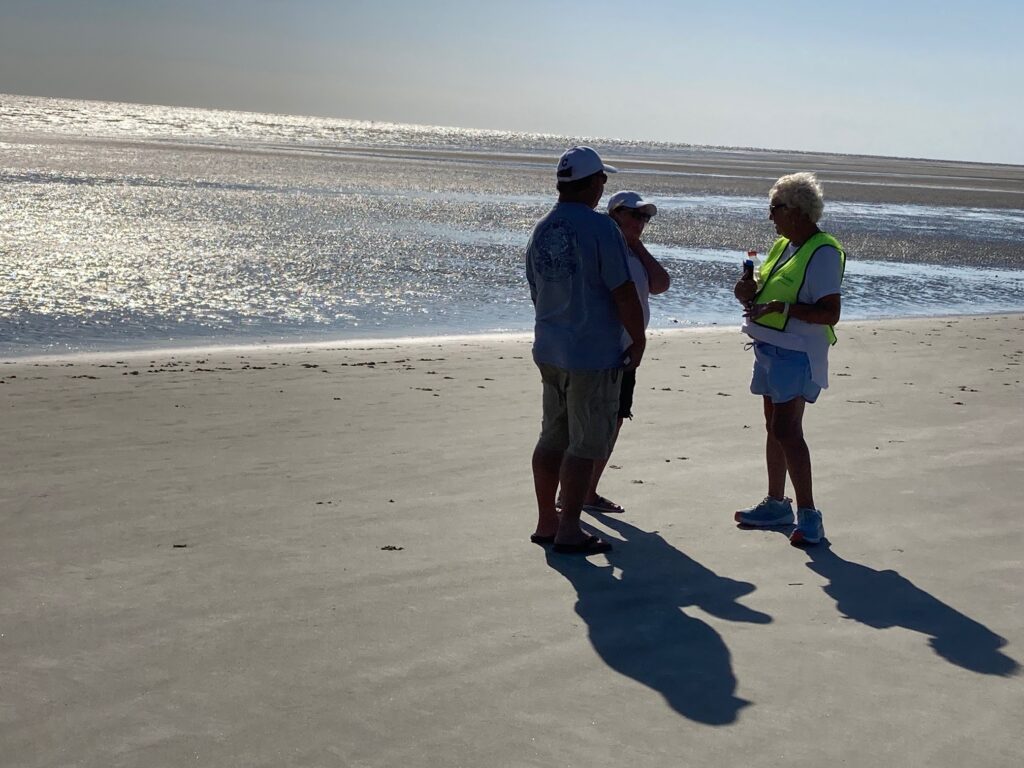
Anecdotal Observations
The purpose of documenting anecdotal observations is to better understand how CBSM is impacting the management strategies at your beach and get feedback on the experiences of those who are implementing the campaigns. Anecdotal observations collected from folks who are on the ground can provide invaluable insight to what is working or not working about your outreach and behavior change strategies. Use this document as a reference or template for questions to ask and learn how collecting this information may benefit you.
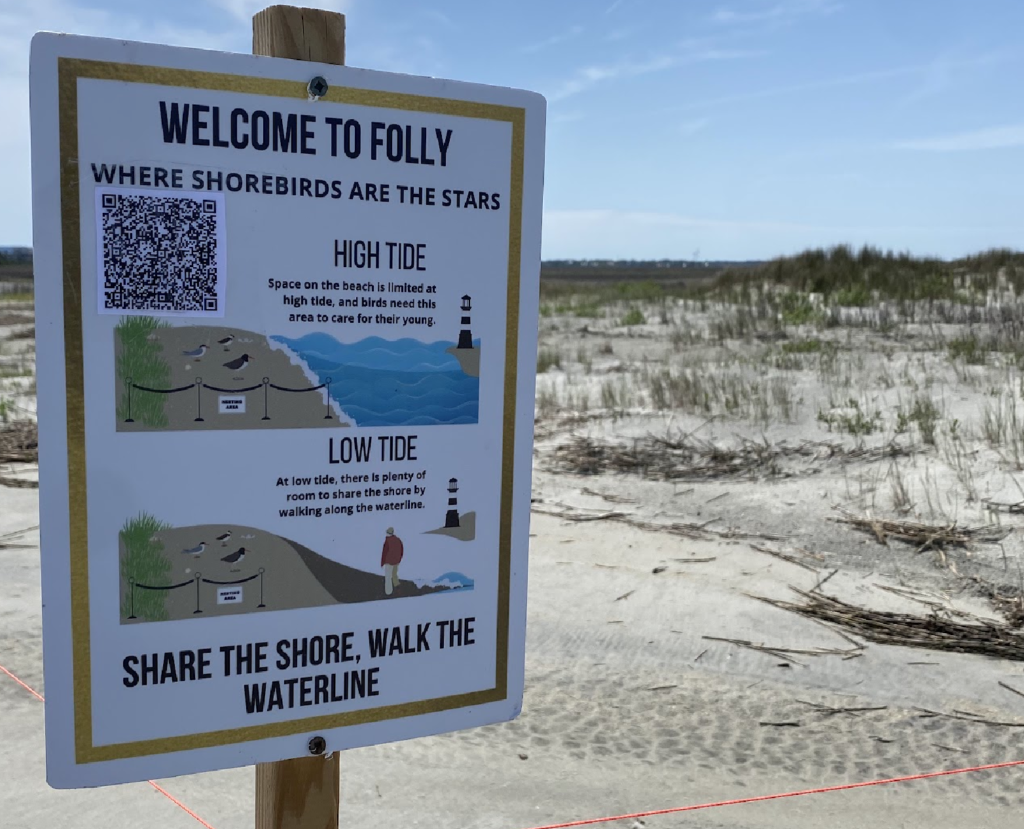
QR Code Overview
QR codes are a great way to quantify outreach and learn more about who is engaging with your materials. View this PowerPoint for more information about QR codes, some options available to you, and examples on how to track metrics based on our Phase III lessons learned.
